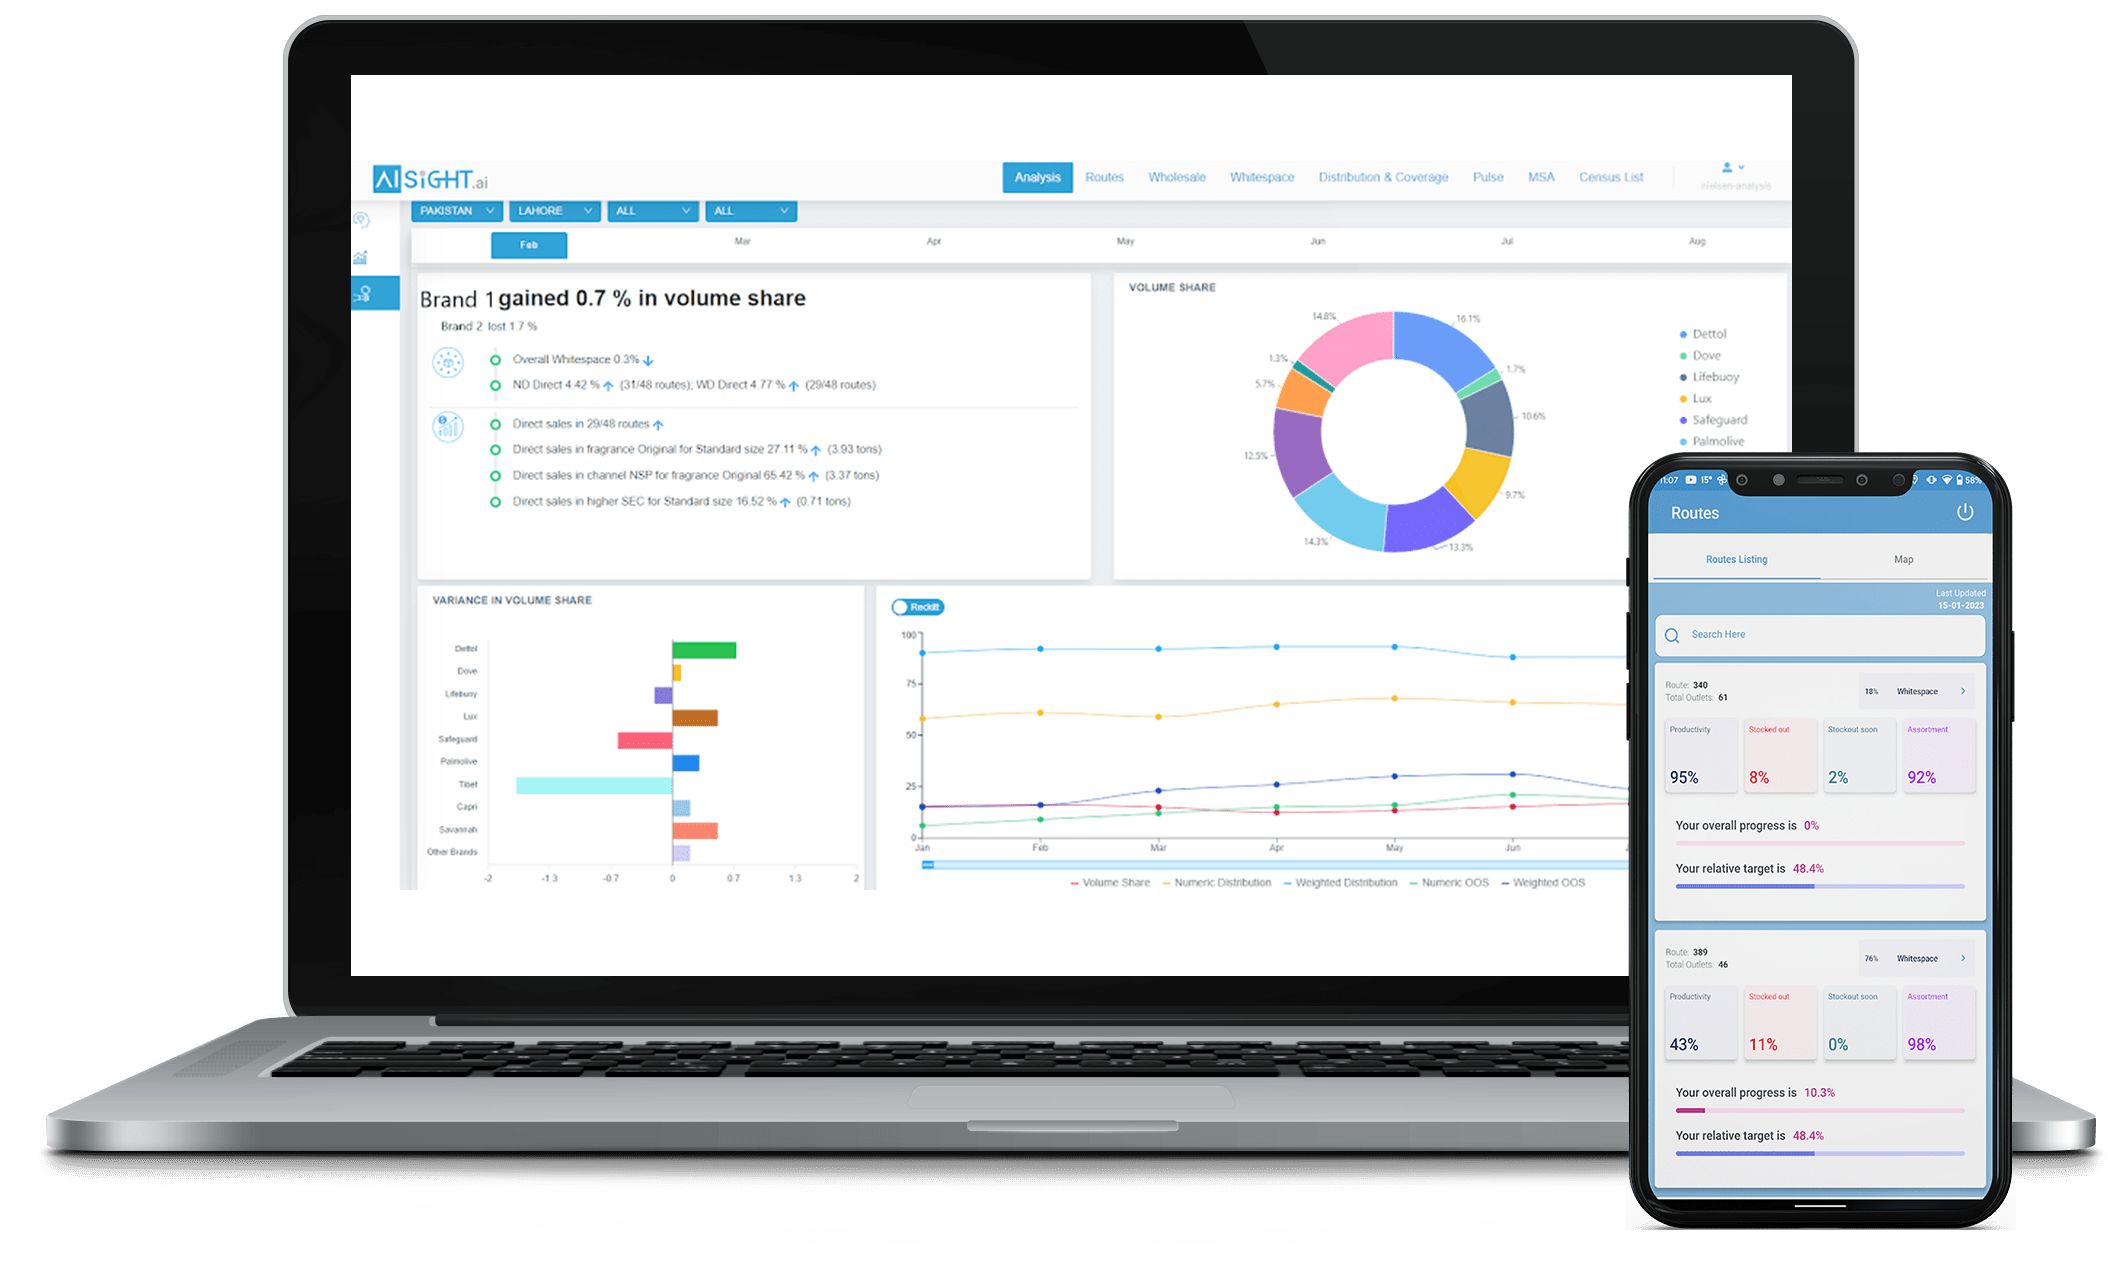
Turn your retail audit data into the granular, actionable and timely insights, for your sales and marketing teams.
Our AI/ML algorithms have been trained on a number of variables with the ability to predict the optimized assortment and out of stocks at the store level. Algorithms not only to descriptive but predictive analysis on the store level.
Market share data is normally an absolute number and not anything near actionable. We combine it with your secondary sales data to make it actionable down to the route and store level.
It takes allot of time and resources to get the market share data and sales data combined finding out the possible effects of change in sales on market share. We have automated this process to find out exactly what you need ahead of time.
We combine the market share and your secondary sales data to identify the non-performing routes, stores, and SKUs.
Helping you make data based decisions for your sales and marketing activities.
Get the population density around your retail universe
Our platform offers Socio Economic class mapping for areas around the world.
Our analytics platfrom RTM and RGM provides a comprehensive ecosystem for conducting surveys.
Our dashboard provides real-time updates for surveys and market research conducted on the platform.
Our dashboard allows real-time tracking of team performance and movement.
Our platform allows users to design surveys according to their specific requirements.
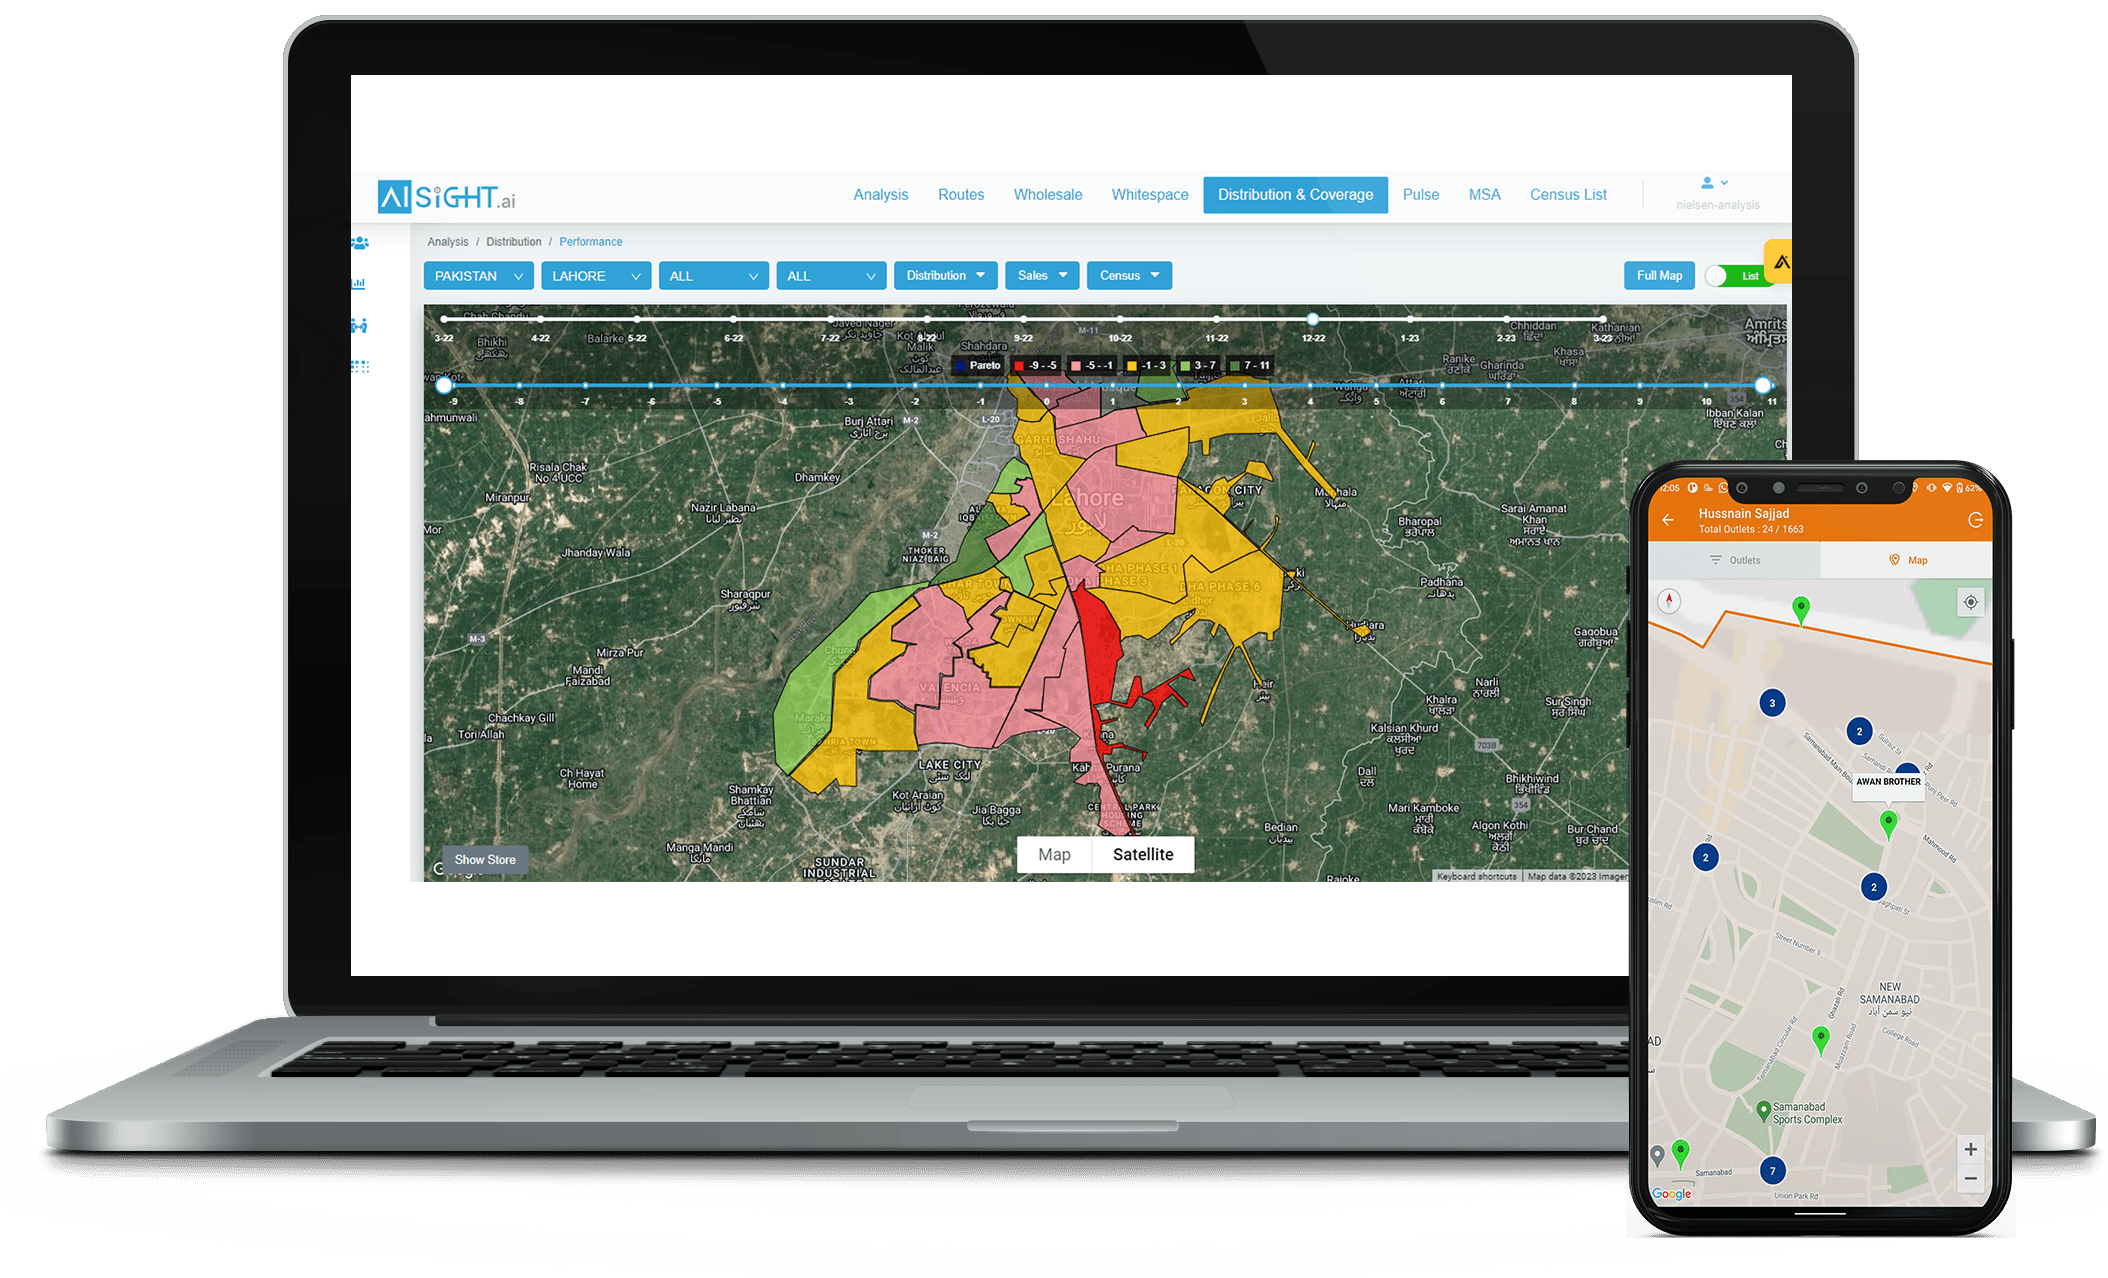
Design your route to market by using cutting edge technologies.
Sell your products where they're needed
Identify population clusters that are not served through your direct distribution
Identify best and worst performing routes
Instantly identify stores about to go out of stock or already out of stock
Store level alerts on non-performing KPIs daily
Assortment: Right SKUs for the specific shop type and appropriate shopper profile for each store in the route
In house built proprietary algorithms give us the ability to map population, SEC and and population density.
We have connected open data sources to our platform to correct the Satellite Imagery Analysis estimation data.
We compare the map data with the rental values of the areas and make corrections to the SEC estimations.
Our technology and processes help us to conduct a retail census accurately.
Hook your secondary sales data to our platform to get the insights.
Add your marketing campaigns data to assess the performance of your campaigns in real-time.
Plug in your retail audit data to the platform and get actionable insights.
Millions of these data points are processed through our AI/ML algorithms to give you real-time insights.
Processing all this data results in practically possible insights.
If you are selling
SKUs
on
Distributors
with
SEC Areas
then
Channels
at
Routes each
at
There can be millions of combinations, affecting your
Market Share!
We pull out exactly the combinations which are affecting your market share.
Improved market share by 713
basis
points in 6 months.
Reduced stockouts by 52%
Increased coverage by 134%
500 basis points improvement
in market
share in 10 months.
300% improvement in
distribution
50% MoM improvement
23% increase in distribution
9% increase in sales
© 2023 Ai sight. ALL RIGHTS RESERVED | POWERED BY: TAMATOS